Ecology take action project.
The skill that I applied most during this project is research capability. During the first few weeks of this project we spent our time researching one topic. After weeks of research on another topic with the deadline just four days away I decided that I wanted this project to be work I could be proud of and we decided to switch topics last minute. Because of this I had to spend hours each night working to get my project finished. This lesson will help me work on my time management because I should have switched our project sooner instead of working on a project I thought was awful, wasting my time and energy.
The two most significant things I did during this project are, researching our topic forming a question, finding data on this topic and synthesizing it into a graph, and I played a big role in my group's Research Paper as well as editing it many times.
One way I experienced difficulty was throughout a lot of the project I was unmotivated to work on it so I found myself off task a lot of the time. One personal characteristic that contributed to the difficulty was my tendency to procrastinate. I find if I am given a long time to work on the project if I don’t keep myself working then I will begin to procrastinate.
One assumption that was contradicted by this experience was the assumption that I could switch topics last minute and still have my project finished on time. If my biology teacher hadn’t generously offered me an extension my project would not have been quality work.
The biggest idea that I learned during this project was just how many people in the US and world are affected by poor water quality as well as how to synthesize information into an infographic.
One skill that I really wish I had prior to this project is designing infographics, because my infographic took me a ton of time due to the fact that I had to figure out how to make an infographic as I was going so the designing of the infographic took me a much longer time than it should have.
The activities we focused on during this project fit well with my learning style because I love creating things digitally hence my passion for the infographics. The one thing I wish is that the topics we chose were assigned or we had a little more help because I found it very hard to find a good topic to use.
Having participated in this project will change the way I work on future projects because I now know that I need to make sure I pick a topic I like/I can produce good work with and I will work on getting started as soon as the work is assigned so I don’t get behind or procrastinate.
Follow up on the Gold King Mine spill; “Orange is the new Animas.”
The Animas River is considered a riparian system/zone. Riparian systems, (all elevation up to 11,000 ft) are characterized as being in or directly adjacent to bodies of water - lakes, streams, rivers or marshy areas. Riparian is also the proper nomenclature for one of the fifteen terrestrial biomes of the earth. Plant habitats and communities along the river margins and banks are called riparian vegetation, characterized by hydrophilic (aquatic) plants. Some of the aquatic plants found in the Animas are cottonwoods, willow, cat-tail, great bulrush, salt-grass, river birch, water sedge, horsetail, and rushes. Riparian systems are also home to a wide range of animals living both in the water and adjacent areas. Some of these animals include beavers, otters, muskrats, mink, western jumping mice, frogs, salamanders, kingfishers, snakes and much more!
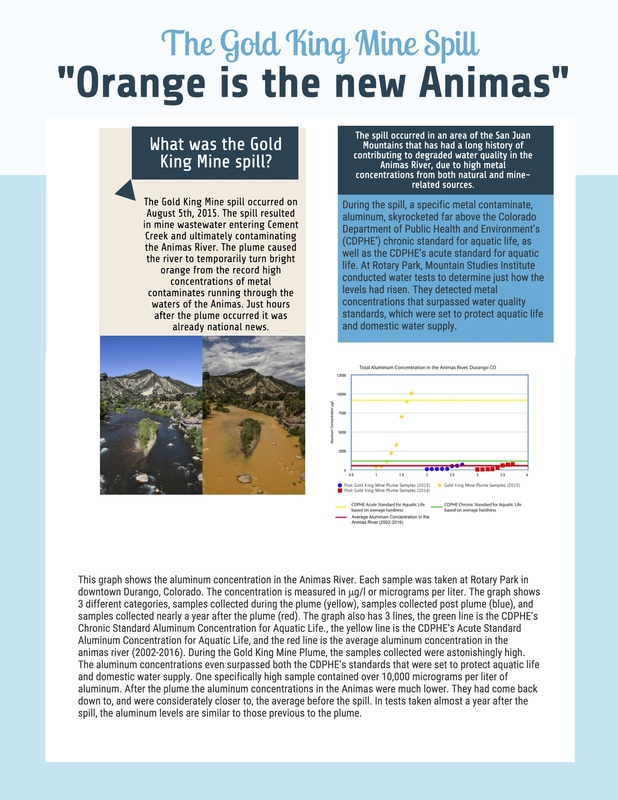
The Gold King Mine spill occurred on August 5th, 2015. The spill resulted in mine wastewater entering Cement Creek and ultimately contaminating the Animas River. The plume caused the river to temporarily turn bright orange from the record high concentrations of metal contaminates running through the waters of the Animas. Just hours after the plume occurred it was already national news.
The spill occurred in an area of the San Juan Mountains that has had a long history of contributing to degraded water quality in the Animas River, due to high metal concentrations from both natural and mine-related sources.
During the spill, a specific metal contaminate, aluminum, skyrocketed far above the Colorado Department of Public Health and Environment’s (CDPHE’) chronic standard for aquatic life, as well as the CDPHE’s acute standard for aquatic life. At Rotary Park, Mountain Studies Institute conducted water tests to determine just how the levels had risen. They detected metal concentrations that surpassed water quality standards, which were set to protect aquatic life and domestic water supply. Which brings up the question, how dangerous was the concentration of aluminum during the plume from the Gold King Mine spill?
This graph shows the aluminum concentration in the Animas River. Each sample was taken at Rotary Park in downtown Durango, Colorado. The concentration is measured in μg/l or micrograms per liter. The graph shows 3 different categories, samples collected during the plume (yellow), samples collected post plume (blue), and samples collected nearly a year after the plume (red). The graph also has 3 lines, the green line is the CDPHE’s Chronic Standard Aluminum Concentration for Aquatic Life., the yellow line is the CDPHE’s Acute Standard Aluminum Concentration for Aquatic Life, and the red line is the average aluminum concentration in the animas river (2002-2016). During the Gold King Mine Plume, the samples collected were astonishingly high. The aluminum concentrations even surpassed both the CDPHE’s standards that were set to protect aquatic life and domestic water supply. One specifically high sample contained over 10,000 micrograms per liter of aluminum. After the plume the aluminum concentrations in the Animas were much lower. They had come back down to, and were considerately closer to, the average before the spill. In tests taken almost a year after the spill, the aluminum levels are similar to those previous to the plume.
The Animas River is considered a riparian system/zone. Riparian systems, (all elevation up to 11,000 ft) are characterized as being in or directly adjacent to bodies of water - lakes, streams, rivers or marshy areas. Riparian is also the proper nomenclature for one of the fifteen terrestrial biomes of the earth. Plant habitats and communities along the river margins and banks are called riparian vegetation, characterized by hydrophilic (aquatic) plants. Some of the aquatic plants found in the Animas are cottonwoods, willow, cat-tail, great bulrush, salt-grass, river birch, water sedge, horsetail, and rushes. Riparian systems are also home to a wide range of animals living both in the water and adjacent areas. Some of these animals include beavers, otters, muskrats, mink, western jumping mice, frogs, salamanders, kingfishers, snakes and much more!
The Gold King Mine spill occurred on August 5th, 2015. The spill resulted in mine wastewater entering Cement Creek and ultimately contaminating the Animas River. The plume caused the river to temporarily turn bright orange from the record high concentrations of metal contaminates running through the waters of the Animas. Just hours after the plume occurred it was already national news.
The spill occurred in an area of the San Juan Mountains that has had a long history of contributing to degraded water quality in the Animas River, due to high metal concentrations from both natural and mine-related sources.
During the spill, a specific metal contaminate, aluminum, skyrocketed far above the Colorado Department of Public Health and Environment’s (CDPHE’) chronic standard for aquatic life, as well as the CDPHE’s acute standard for aquatic life. At Rotary Park, Mountain Studies Institute conducted water tests to determine just how the levels had risen. They detected metal concentrations that surpassed water quality standards, which were set to protect aquatic life and domestic water supply. Which brings up the question, how dangerous was the concentration of aluminum during the plume from the Gold King Mine spill?
This graph shows the aluminum concentration in the Animas River. Each sample was taken at Rotary Park in downtown Durango, Colorado. The concentration is measured in μg/l or micrograms per liter. The graph shows 3 different categories, samples collected during the plume (yellow), samples collected post plume (blue), and samples collected nearly a year after the plume (red). The graph also has 3 lines, the green line is the CDPHE’s Chronic Standard Aluminum Concentration for Aquatic Life., the yellow line is the CDPHE’s Acute Standard Aluminum Concentration for Aquatic Life, and the red line is the average aluminum concentration in the animas river (2002-2016). During the Gold King Mine Plume, the samples collected were astonishingly high. The aluminum concentrations even surpassed both the CDPHE’s standards that were set to protect aquatic life and domestic water supply. One specifically high sample contained over 10,000 micrograms per liter of aluminum. After the plume the aluminum concentrations in the Animas were much lower. They had come back down to, and were considerately closer to, the average before the spill. In tests taken almost a year after the spill, the aluminum levels are similar to those previous to the plume.